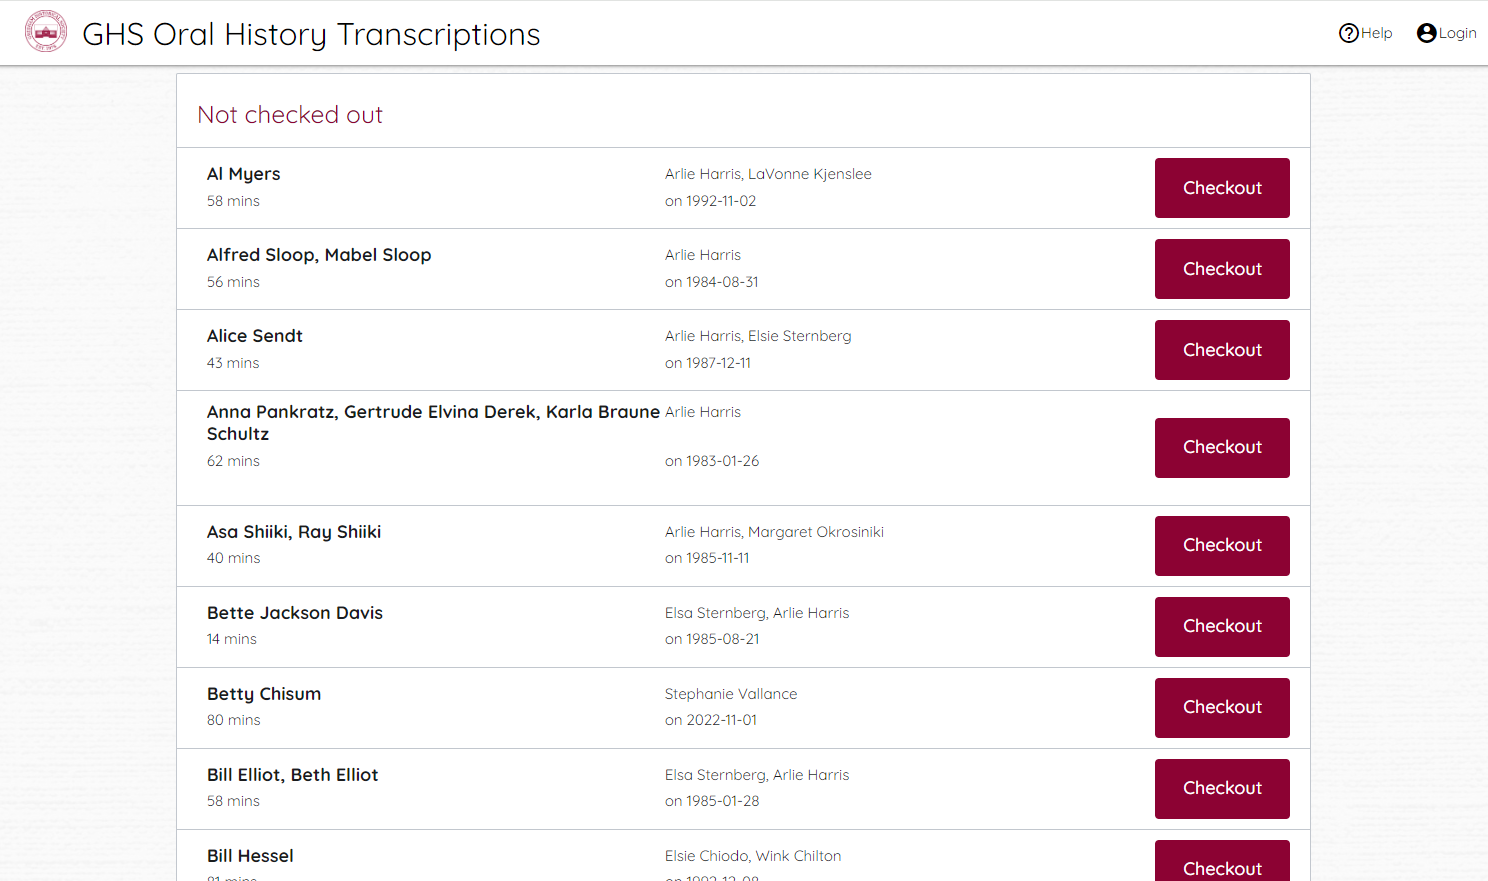
Furin Project
Through the GIS Club, a few students and myself worked with APANO catalyst artist Midori Hirose on a project to celebrate the Japanese-American farming history of SE Portland. We developed a web application for people to submit sound, images, and their thoughts of the community around them. These were displayed on an interactive web map. We also used Esri's Storymaps to create a more textual narrative about the history, project, and our contribution. The project culminated in a symposium in which we presented our work and a gallery exhibit at PCC Southeast Campus. A variety of Esri, open source, and custom-built software (using HTML/CSS/JS, Go, and MySQL) was used to accomplish our goals.

Snowline fluctuations on Mt Hood with Sentinel-2
In my final project for "Remote Sensing," I used a lot of Python to interact with the Sentinel-Hub API, ArcPy, and Jupyter Notebooks. In addition to the poster (the class deliverable), I made a few interactive components and shared my project on github. I also presented my project at GIS in Action 2024 in a lightning talk, and submitted it for the map gallery in which it won first place in the student category.

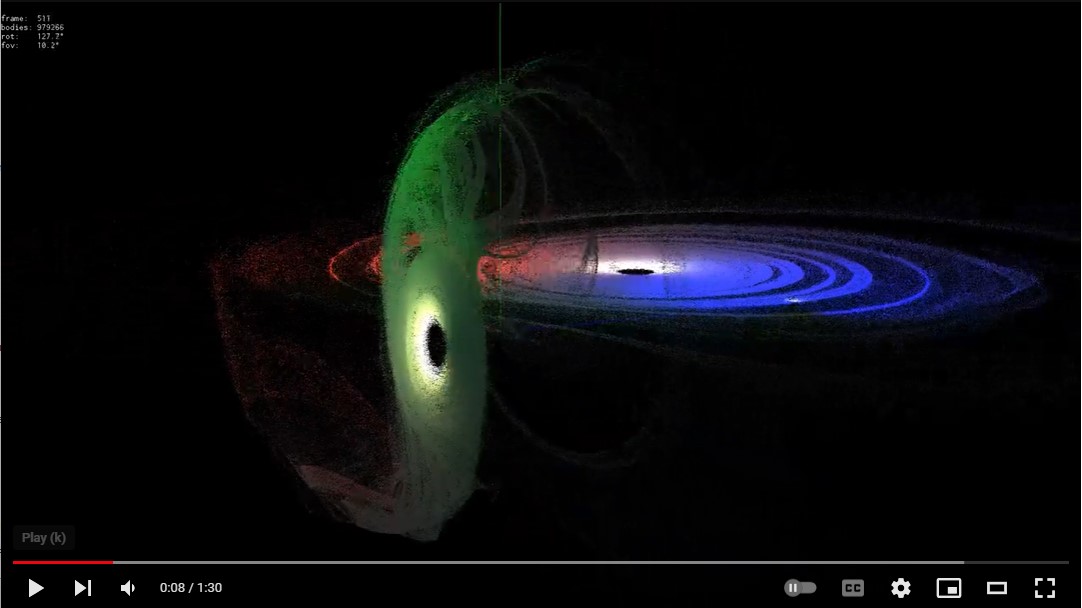
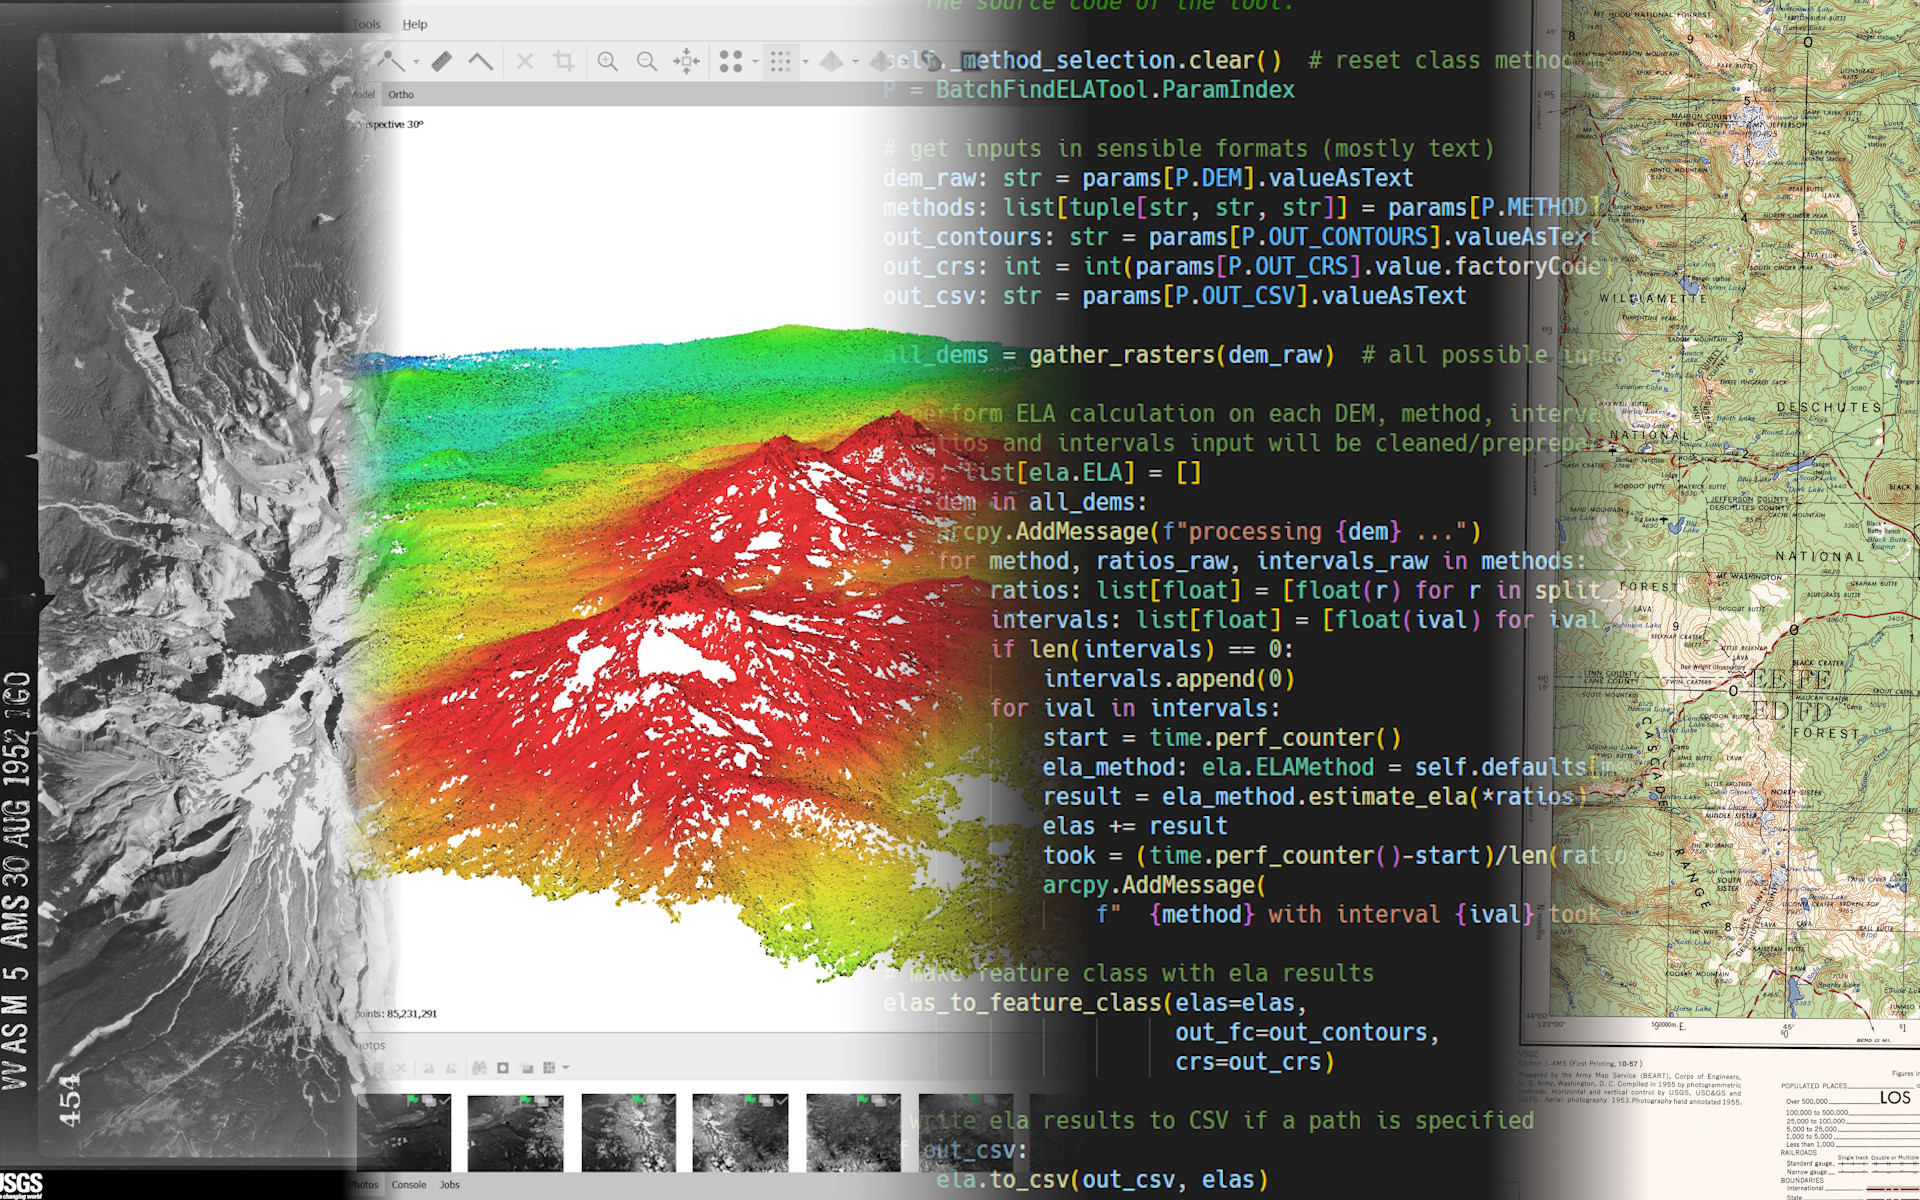
Tracking Oregon Glaciers
My partner Shawn Stanton and I worked on a project for the Oregon Glaciers Institute (OGI) to create assets that would help them conduct research on the glaciers of Mt Hood, Mt Jefferson, and the Three Sisters. Our primary products were a series of DEMs created from 1950s era aerial photos and a ArcGIS Pro geoprocessing toolbox to calculate equilibrium line altitudes (ELAs). We used our assets and some before-after images from OGI to create an "interactive experience" that can be seen in our storymap.
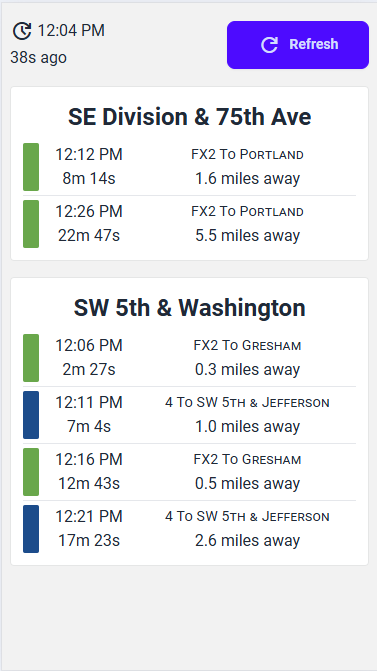
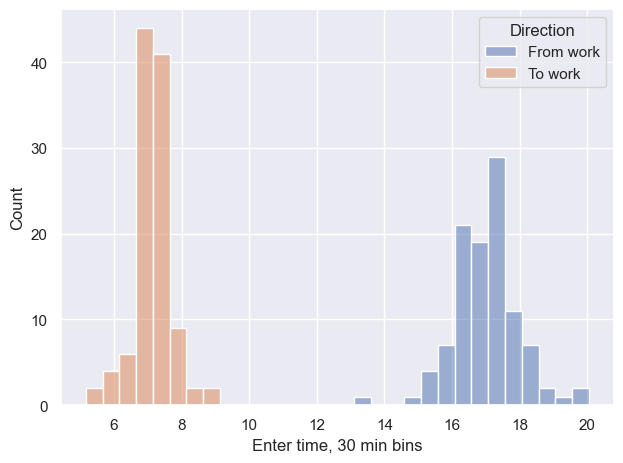
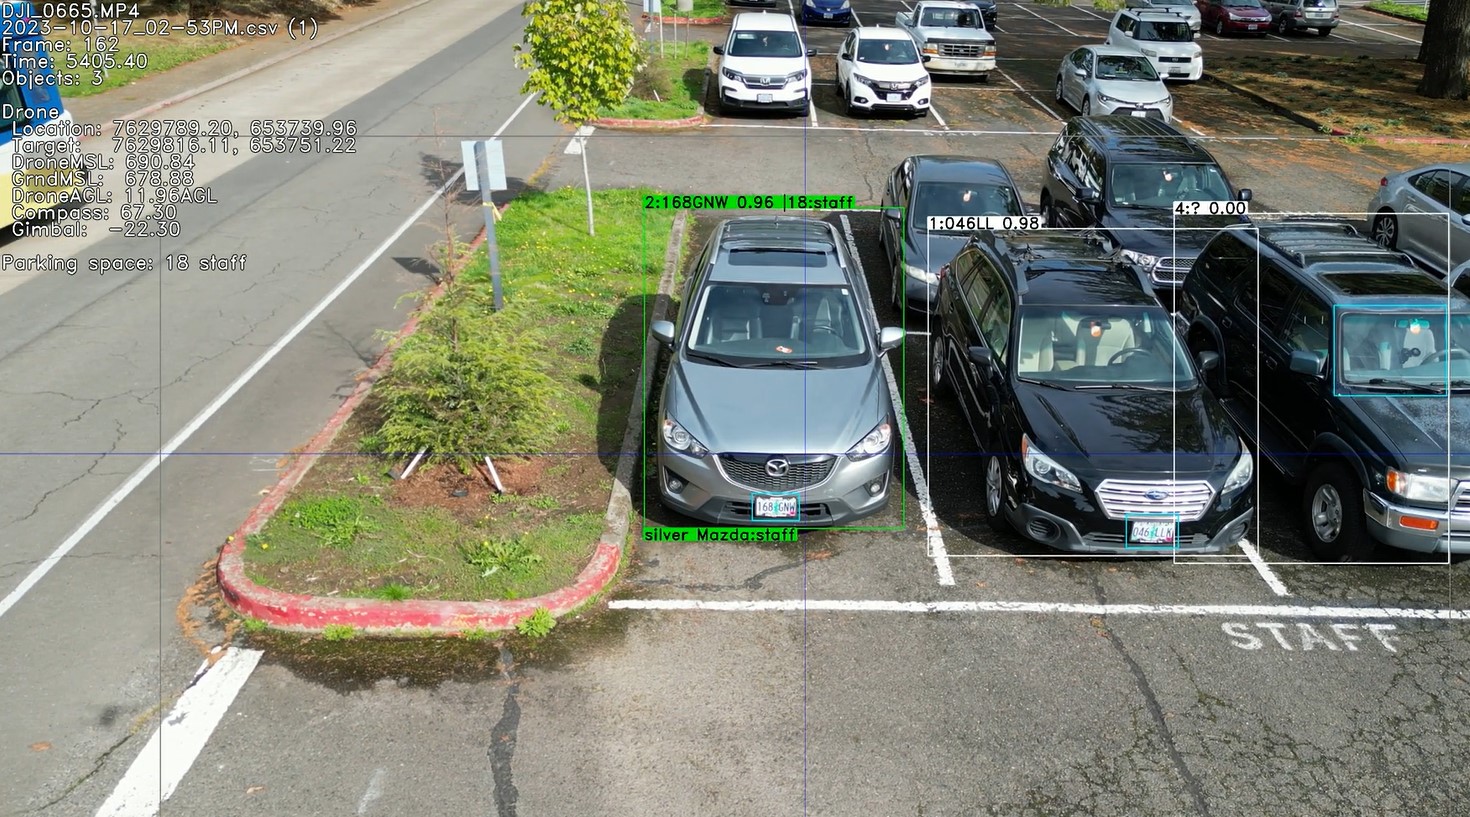
Drone-based license plate detection and parking validation
For my final project in "Modeling with Drones 2", I took inspiration from a guest presentation by BNSF Sr. UAS Manager Nick Dryer to use drone video footage, computer vision, and GIS assets to automatically detect vehicles, locate their license plates, read the text from the plates, and validate that the vehicle had a permit appropriate for its parking space. My project is presented in a storymap, and the code is available on Github.
Photogrammetry with historic aerial photographs
For my final project in "Modeling with Drones 1", I decided to experiment with using open-source photogrammetry software Open Drone Map (ODM) to orthorectify aerial single frame photos of Portland taken roughly in 1950, 1960, and 1970. I wrote a Python script to automate processing of the entire dataset. To present the completed orthomosaics in a compelling manner that allowed the user to compare changes among decades, I wrote a simple web application that uses a slider to control the transitions in the interactive map.
Alternative timeline Pony Express
What might the Pony Express look like if had been fully built out as a network of routes between all settlements in the American West in 1860? I tried to answer this question for my "GIS Analysis" final project. Using primarily DEM and NLCD data at 100m resolution for the entire western US, I created a travel cost surface and used ArcGIS Pro's least-cost path tool to determine efficient routes between settlements in 1860. I used a few of the Network Analyst tools to determine travel distances between settlements at regular intervals for "home stations."
Map 1: Historic western trails
Map 2: Generated routes by nearest settlement
Map 3: Generated routes by distance from settlement
Map 4: Comparison of original and alternative Pony Express
Vehicular accident risk in Portland
Using a variety of publicly available data from the City of Portland, I created a suitability model for the risk of a car accident on Portland streets. I added to the "normal risk" (dry streets) model with data relevant to winter conditions to model risk in snow conditions. Finally, I visualized the difference between the two models.
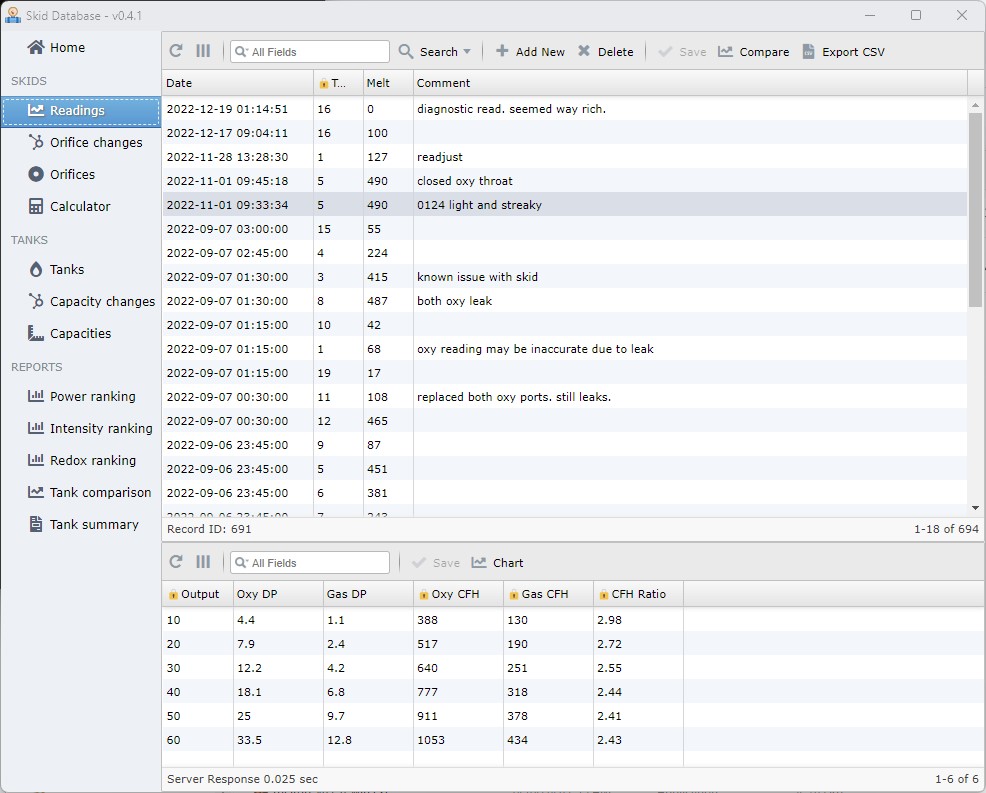
US Census API toolbox
For my final project in "GIS Programming", I decided to create a set of script tools for ArcGIS Pro to make it easy to add US Census data to geometries with appropriate FIPS numbers. The primary tool will use the JSON-based API provided by census.gov to fetch metadata for the year and dataset, and allow the user to choose individual variables and/or groups. The tool will cache all calls to the API, particularly when fetching metadata, to improve performance and reduce stress on the remote server for subsequent uses. Another tool performs a similar function, but uses user-downloaded CSV data instead. Two other tools help manage the cache.

Unsupervised vs Supervisied Classification
This was an exercise for "Remote Sensing" to learn about using two broad categories of image classification. Though not a particularly cartographically interesting topic, I decided to make it fun and went all-in on the "vs" idea with a boxing themed layout.

Changes to regional population, temperature, and land use
This exercise for "Remote Sensing" was a forey into change analysis in the Portland metro region. I thought that to tell the story better, I needed more assets than were given in the execise. I obtained block-level population from the 1990 and 2020 decentennial census and aerial imagery circa 1990. I could then truely show how the population and land use has changed over 30 years, and the resulting effects on surface temperature patterns.
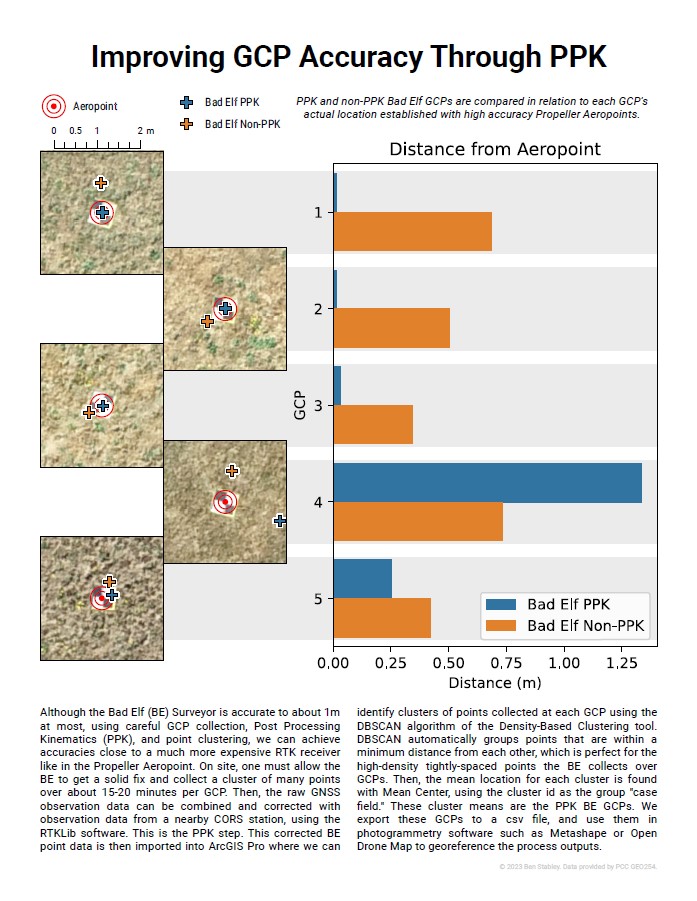
Using PPK to improve GCPs
This exercise for "Modeling with Drones 2" illustrates how to use less expensive GNSS receivers such as a Bad Elf Surveyor to achieve nearly the same accuracy as a more expensive RTK receiver such as the Propeller Aeropoint. Bad Elf data was collected, processed with RTKLib and CORS station data in a Post-Processing Kinematics (PPK) workflow, and then clustered and averaged to obtain the final GCPs.
Log Pond
This exercise for "Modeling with Drones 1" used drone imagery of a drained log pond to establish baseline GIS assets before restoration to a wetland. It illustrated how to selectively ignore troublesome images from the photogrammetry process and how to further improve raster data (DEM in this case) in ArcGIS Pro. In a few of my Modeling with Drones classes, I created maps as if I was preparing products for clients of my fictious company "Red Engineering."

Stock piles
Another "Red Engineering" project that used drone imagery to calculate the volumes of stockpiles. In this case, I did further estimates for (imaginary) remediation of the site as if the stockpiles were uranium mill tailings.

Walkability
This was an exercise in using the network analysist tools of ArcGIS Pro to determine the walkability and shortest walking paths between PCC Sylvania and two MAX stops on the proposed SW Corridor MAX line. I decided to heavily stylize my map to look like an architectural blueprint.

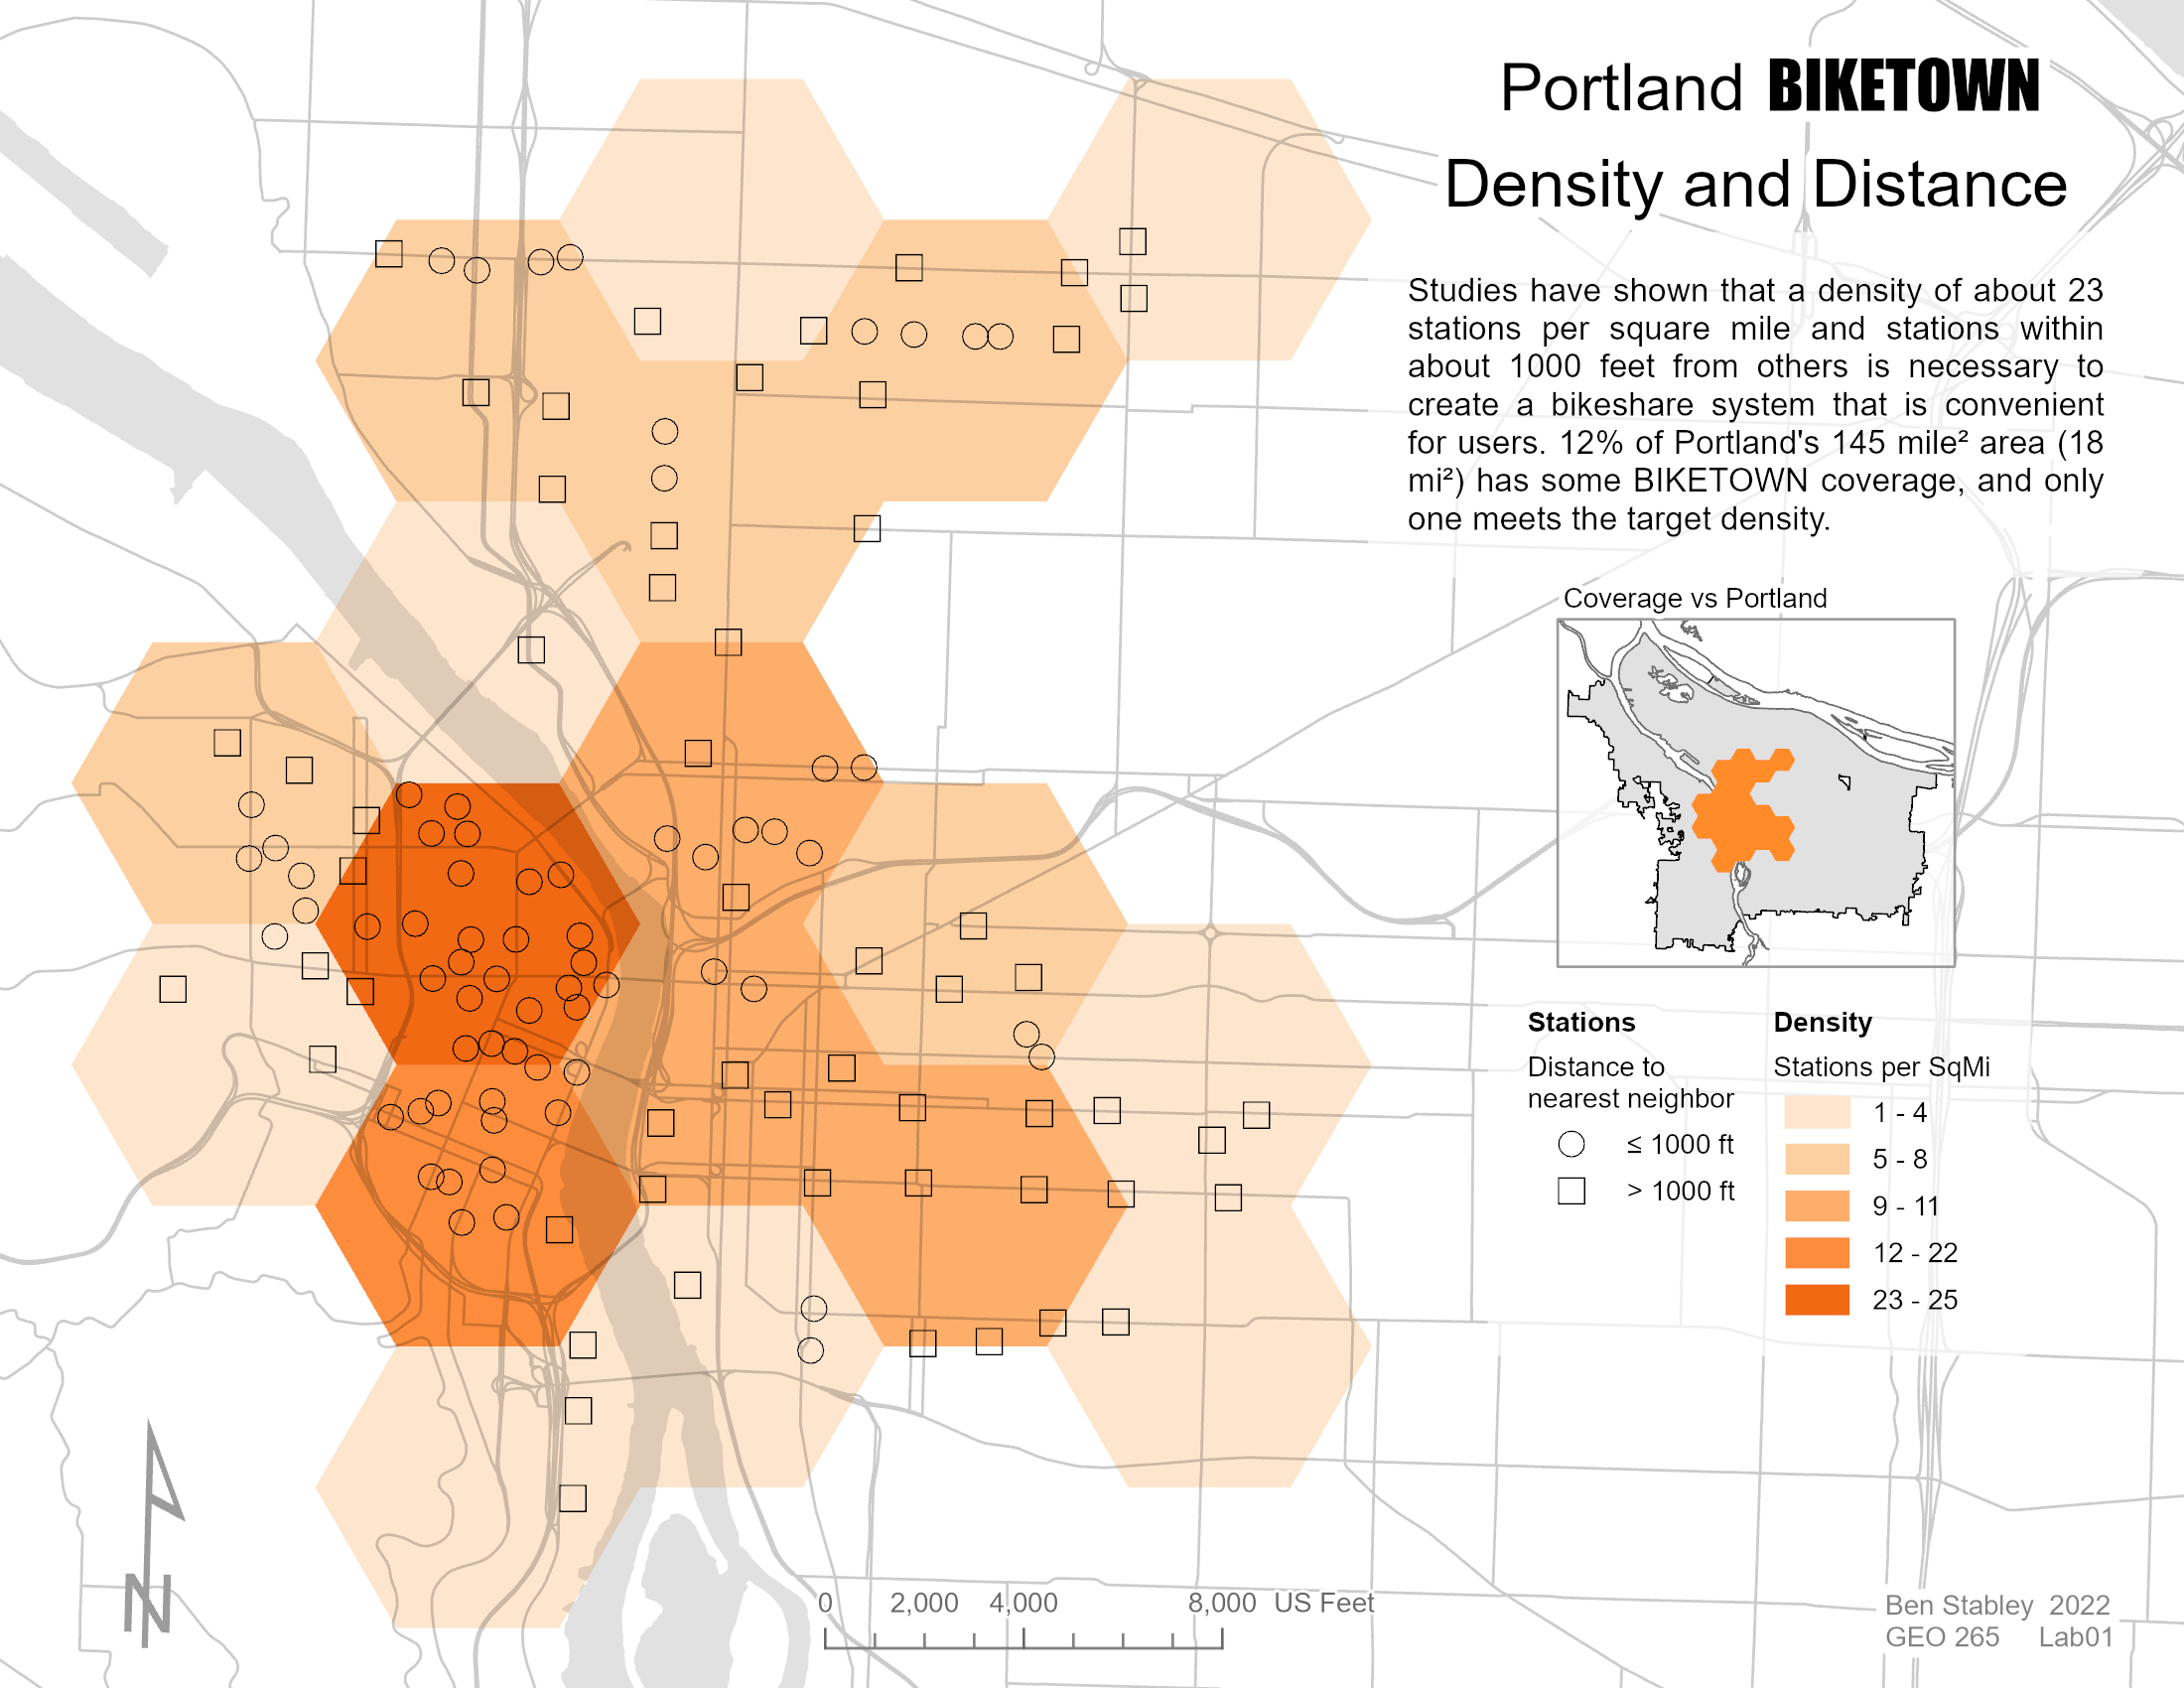
Biketown
This map examined the distribution of Nike Biketown stations in Portland, although it uses data that is several years out of date.
McCarthy Creek
In this exercise, we selected places for wildlife corridors and land bridges to connect disjoint forest areas of Metro's North Tualatin Mountains holdings. I attempted to stylize the map in a similar fashion to those in some of the background material provided to us by the exercise instructions.